Information
Information Handling is the statistics unit of the Class 10 Mathematics PECTAA New Book. Building on the frequency distributions learned in Class 9, this unit teaches students to organize large data sets,
🎓 Online Classes with Experienced Experts
visualize them with graphs, locate key positional values, and measure how spread out the data is. These are practical skills used in research, business, sports analysis, and everyday decision-making.
What This Unit Covers
1. Cumulative Frequency Tables Students learn that a cumulative frequency is a running total of frequencies, where each class’s frequency is added to the sum of all frequencies before it. Starting from an ordinary frequency distribution, students build a cumulative frequency table that shows how many observations fall at or below each class boundary.
2. The Cumulative Frequency Polygon (Ogive) An ogive is the graph of a cumulative frequency distribution. Students plot cumulative frequencies against class boundaries using either the “less than” method (upper boundaries) or the “more than” method (lower boundaries), then join the points with a smooth curve. From this curve, they read off the median, quartiles (Q1, Q2, Q3), deciles, percentiles, and the interquartile range, using the position formulas n/2 for the median, n/4 and 3n/4 for the quartiles, and similar formulas for deciles and percentiles.
3. Box-and-Whisker Plots A box-and-whisker plot displays the five-number summary of a data set: the minimum value, the lower quartile, the median, the upper quartile, and the maximum value. Students construct box plots from raw data or from a given five-number summary, and interpret an existing box plot to describe where the data is clustered and how spread out it is.
4. Scatter Diagrams and Correlation A scatter diagram plots pairs of values for two variables to reveal any relationship between them. Students draw a line of best fit through the points and use it to make estimates. They classify the relationship as positive, negative, or zero correlation, and further describe it as strong or weak based on how closely the points follow the trend line.
5. Measures of Dispersion The unit closes with numerical measures of spread: the range (the difference between the highest and lowest values), the variance (the average of the squared deviations from the mean), and the standard deviation (the square root of the variance). Students calculate these for both ungrouped and grouped data, and use the mean together with the standard deviation to compare the consistency of two data sets, such as the performance of two students or two machines.
Why This Unit Matters
Information Handling turns raw numbers into a form that is easy to read and compare, which is exactly what statistics is used for in real life: exam results, weather records, sales figures, and sports performance. Board exams typically include a full question on constructing an ogive and reading quartiles from it, a box-and-whisker plot question, and a shorter question on variance or standard deviation, so this unit offers dependable, well-structured marks.
How to Study Unit 11
- Practise building a cumulative frequency table from an ordinary frequency table until it becomes automatic; every later calculation in this unit depends on it.
- When reading a value from an ogive, always draw the horizontal line to the curve first, then the vertical line down to the x-axis, and mark both clearly.
- Learn the position formulas for the median, quartiles, deciles, and percentiles side by side, since they are all found the same way.
- For scatter diagrams, draw the line of best fit through the middle of the points, with roughly equal points above and below it.
- Keep the two variance formulas (using deviations from the mean, or using the sum of squares) ready, and choose whichever is quicker for the numbers given.
Practice Questions – Unit 11
Short Questions
- Define cumulative frequency and explain how a cumulative frequency table is built from an ordinary frequency table.
- State the formula used to find the position of the median in a set of n observations.
- What does the interquartile range measure, and how is it calculated?
- Name the five values shown on a box-and-whisker plot.
- State whether height and weight of students usually show positive, negative, or zero correlation.
- Write the formula for the range of a data set.
Long Questions
- The marks of 40 students are grouped into six classes. Explain the steps needed to construct a cumulative frequency polygon by the “less than” method and to locate the median from it.
- For the data 5, 8, 3, 9, 12, 7, 10, 6, 14, 11, find Q1, Q3, the median, the range, and the interquartile range, and draw a box-and-whisker plot.
- A survey records the hours spent studying and the test scores of 8 students. Explain how to construct a scatter diagram for this data, draw a line of best fit, and describe the correlation shown.
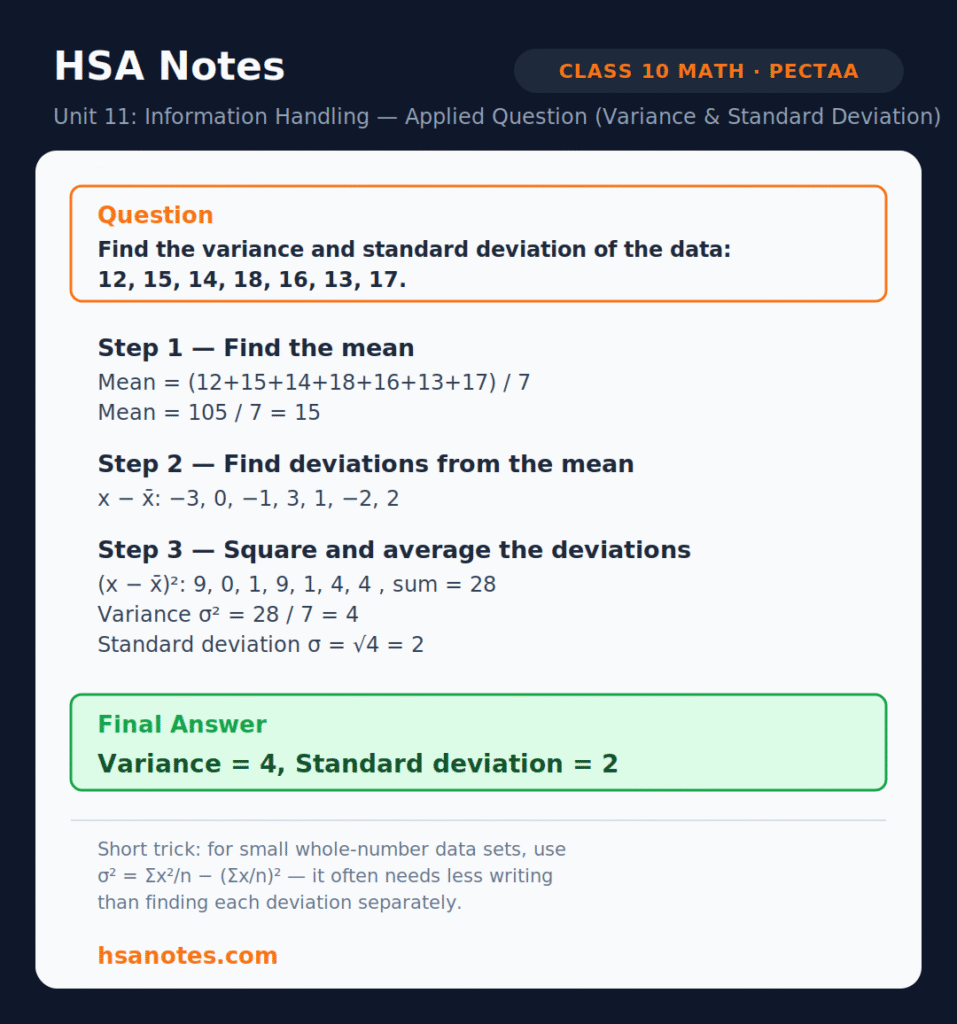
- Find the variance and standard deviation of the data set: 12, 15, 14, 18, 16, 13, 17.
- Explain, with an example, how the mean and standard deviation together are used to compare the consistency of two data sets.
Applied Questions
- The weekly pocket money (in rupees) of 60 students is grouped into five classes. Construct a cumulative frequency table and explain how you would find the 60th percentile from an ogive drawn for this data.
- Two bowlers took wickets in 8 matches: Bowler A: 2, 3, 1, 4, 2, 3, 2, 3; Bowler B: 0, 5, 1, 6, 0, 5, 1, 6. Find the mean and standard deviation for each bowler, and state which one is more consistent.
- A company records its daily sales (in thousands of rupees) for 10 days: 45, 48, 50, 47, 46, 49, 44, 51, 48, 47. Find the range, variance, and standard deviation of the sales.
- The table below shows the daily temperature and the number of cold drinks sold at a shop for 7 days. Explain how a scatter diagram of this data would help the shop owner plan stock, and what type of correlation you would expect.
About HSA Notes
HSA Notes is an educational resource platform providing free study materials for Pakistani students, covering FBISE, Punjab, Sindh, and KP Boards in line with the New Books System. Materials span grades 9–12 across Mathematics, Chemistry, Biology, Physics, Computer Science, English, and Urdu, all prepared in a consistent, easy-to-follow branded format.
Besides free unit-wise notes and solved exercises, HSA Notes also offers online classes for students who want structured, teacher-guided sessions alongside self-study, useful for learners who need concepts explained step by step or want doubt-solving support beyond what a PDF can provide. For online classes, contact: hsanotes48@gmail.com
Conclusion
Unit 11 – Information Handling gives Class 10 students a complete toolkit for organizing, visualizing, and summarizing data: cumulative frequency tables, ogives, box-and-whisker plots, scatter diagrams, and the measures of dispersion. These skills are not only exam-scoring but genuinely useful outside the classroom, from reading a school report card to understanding a news report. Regular practice with the questions above, along with HSA Notes’ online classes where extra support is needed, will help students handle this unit with confidence.